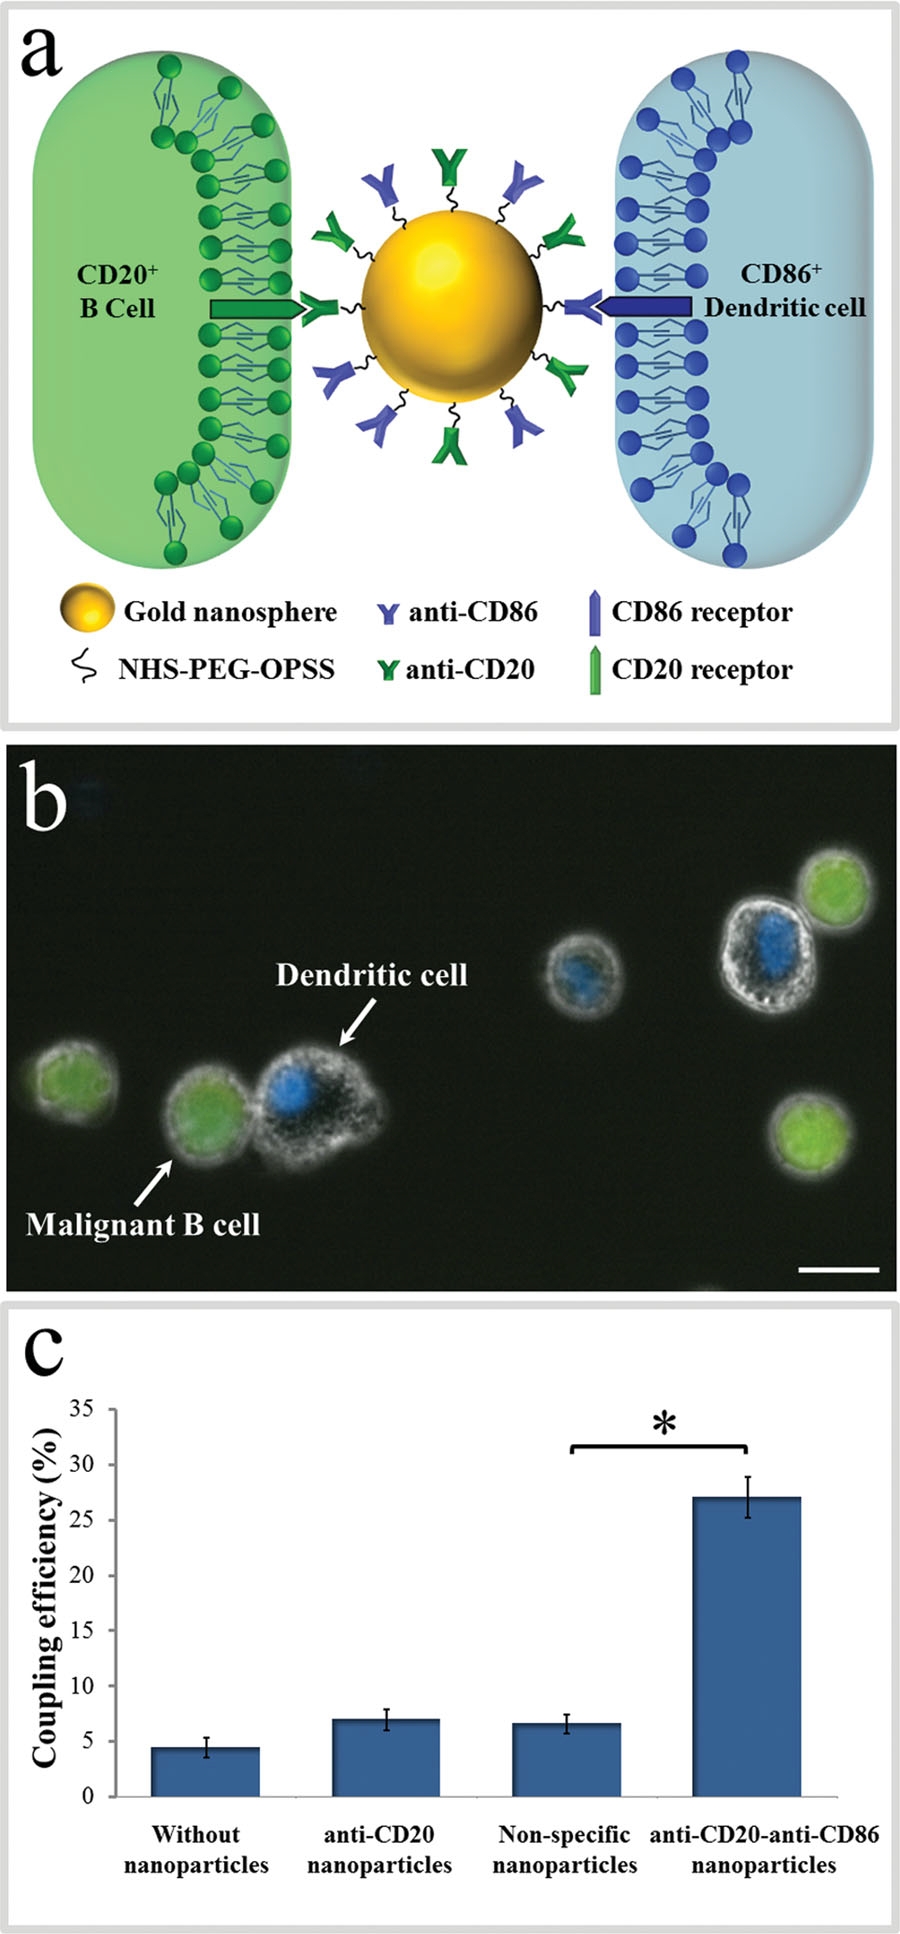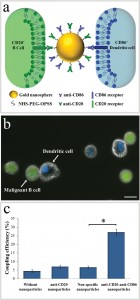
Figure 1
The attachment between two different cells via a bispecific nanoparticle is illustrated in Figure 1a. Following the addition of the nanoparticles to the growth medium of an equally (1:1) mixed BJAB (green labeled) and human monocyte-derived dendritic (blue labeled) cell population (Figure 1b), approximately 30% of the cells formed pairs or small clusters of physically attached cells (Figure 1c). Significantly lower cell attachment levels of 7, 6.5, and 4.5% were observed when incubating similar cell mixtures with only single antibody (anti-CD20) nanoparticles, nonspecific antiepidermal growth factor receptor (EGFR)-coated nanoparticles, and in the absence of nanoparticles, respectively.
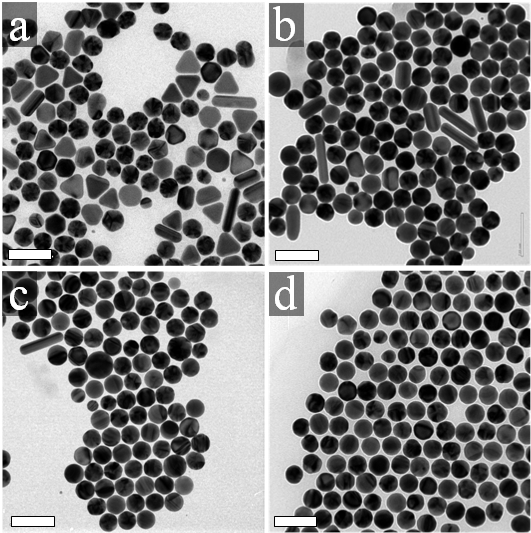
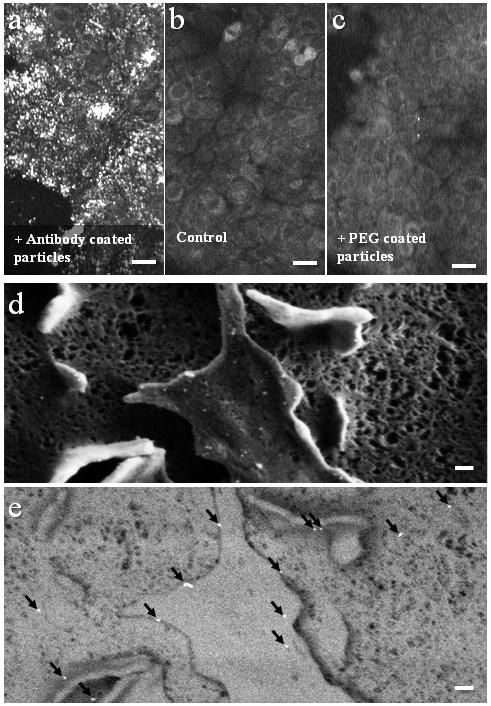
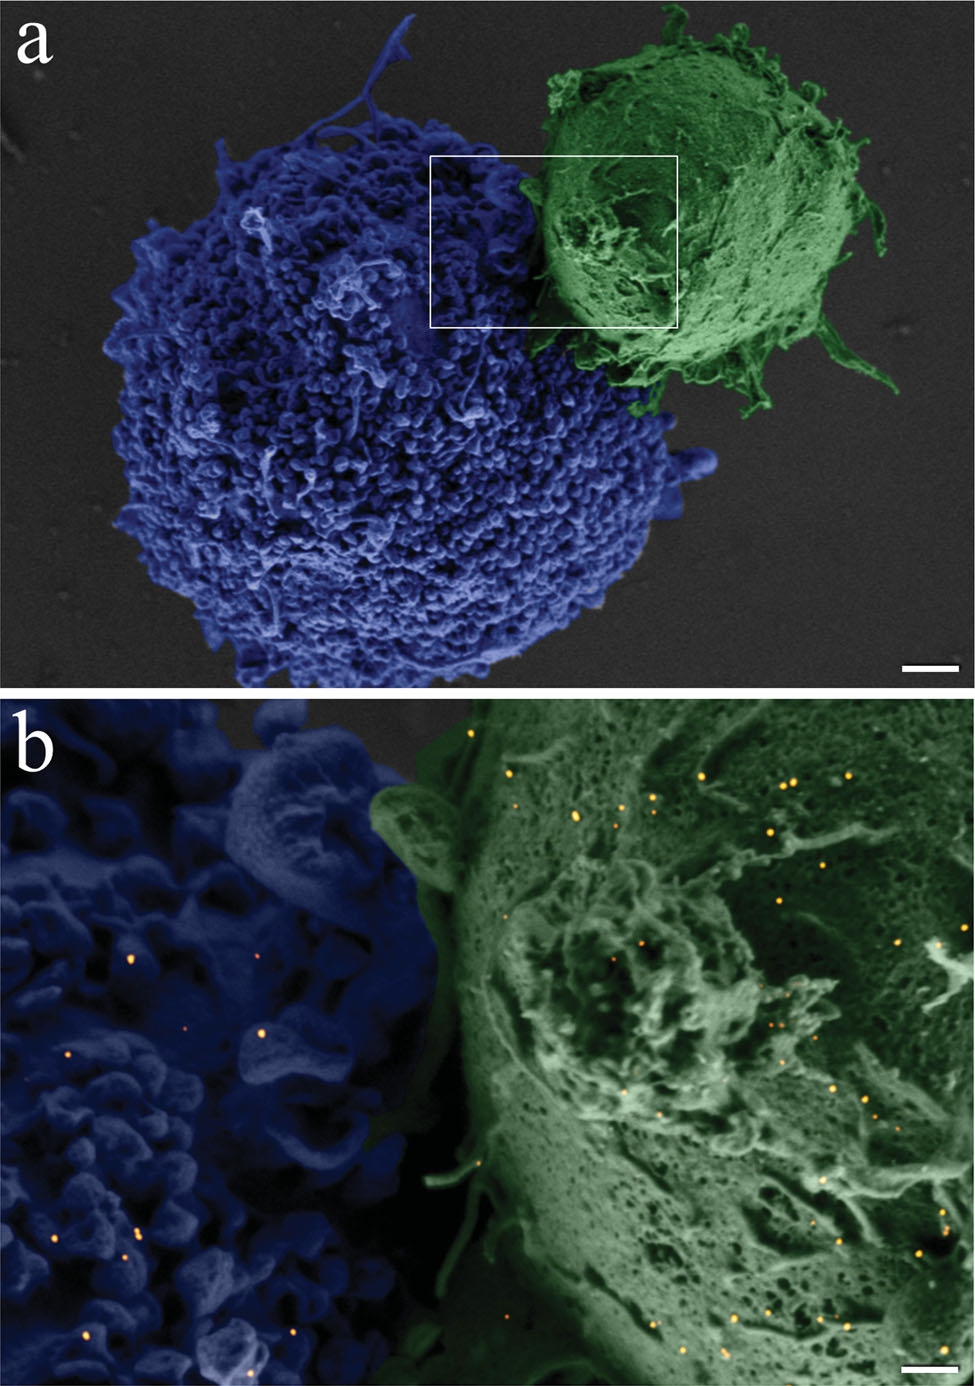
A closer view of a fi xated BJAB–DC pair is shown in the false-color scanning electron microscopy (SEM) image ( Figure 2a), revealing the light-toned BJAB cell (green) attached to the larger and feature-rich DC (blue). A magnified view (Figure 2b) of the region marked by a rectangle in Figure 2a, overlaid by an atomic-number-sensitive image of the same fi eld of view, reveals a relatively uniform distribution of the individual gold nanoparticles (orange yellow) on the plasma membranes of both cells, without any noticeable particle aggregation. Based on these images, we estimate particle densities of approximately 40 and 12 particles per μm^(−2) on the BJAB and the DCs, respectively. As expected, due to the presence of numerous identical antibodies on each particle, attachment between cells of a similar type after incubation with bispecific nanoparticles was also evident: more than 40% of the BJAB cells and approximately 2% of DCs appeared as part of small (2–10 cells) clusters.

Figure 2
Cells engaged in a physical contact do not normally fuse together in the absence of specific biological or chemical induction signals. Consequently, spontaneous fusion
events were not observed at any of the cell cultures even after several hours. In a previous work we have shown that cells within a homogeneous solution incubated with monospecific (single antibody coating) gold nanospheres were led to fuse following irradiation by a few high-intensity femtosecond pulses that were tuned to the plasmonic resonance wavelength of the nanoparticles. The fusion effi ciency of cells of different types was extremely low in these experiments due to the random and transient physical contacts between the cells.
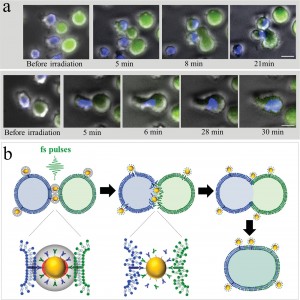
Figure 3
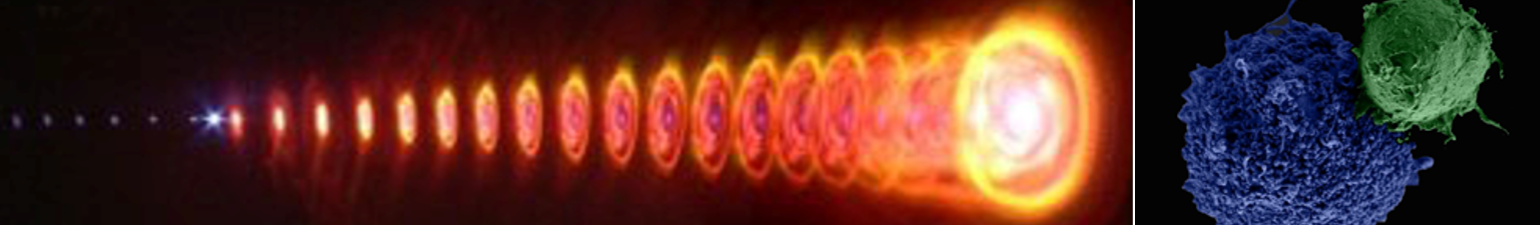
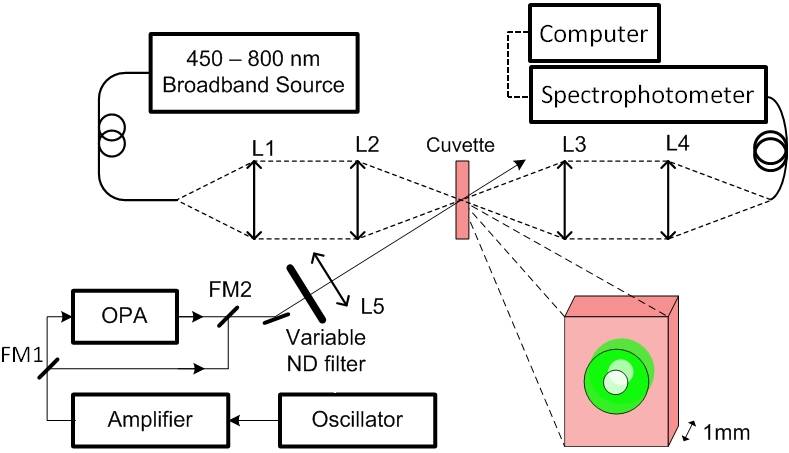
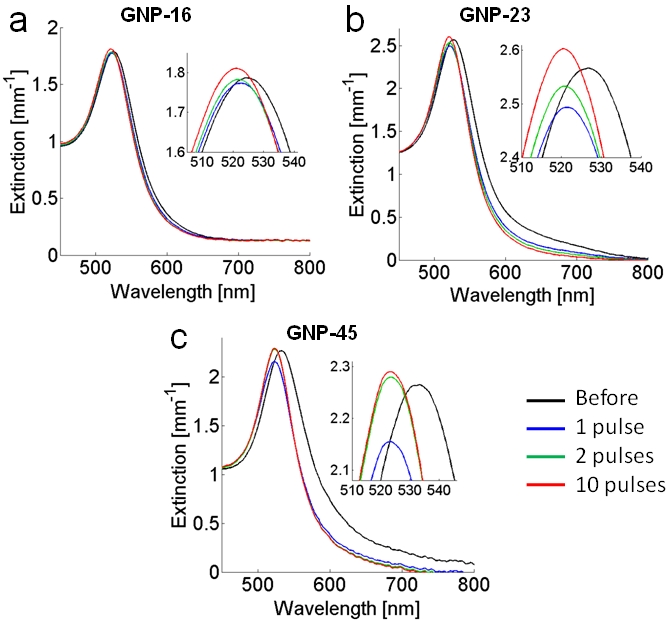
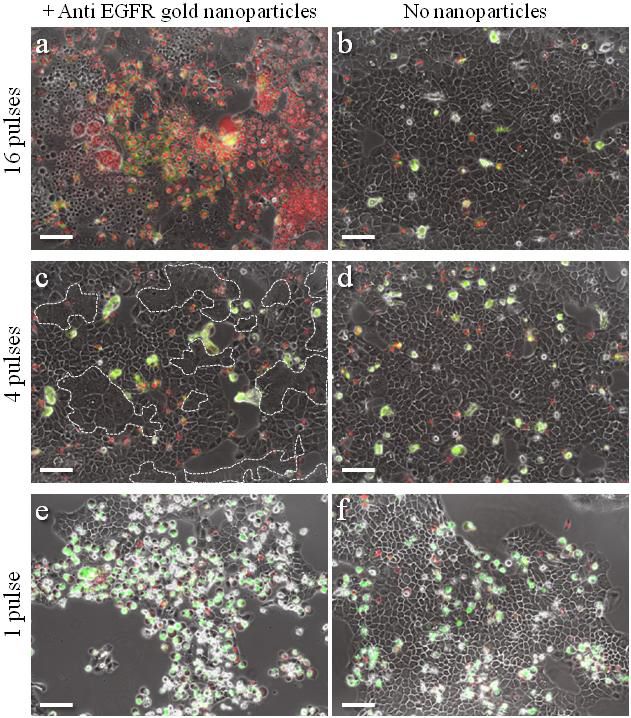
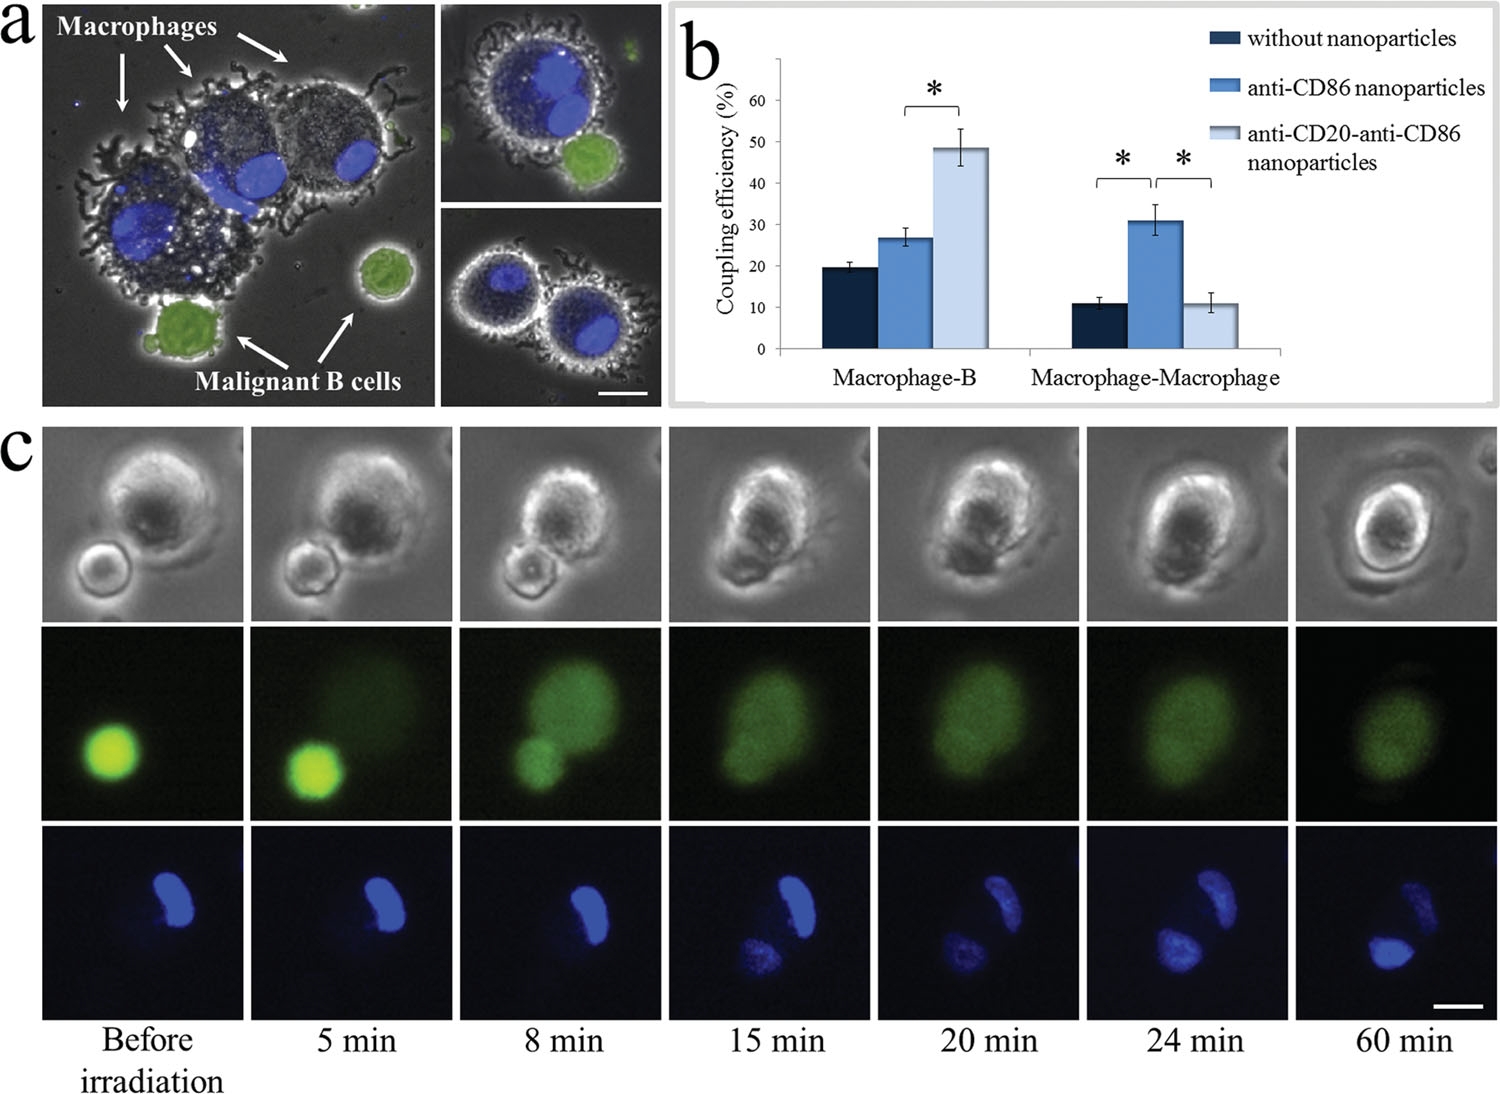
To demonstrate specific cell fusion, the entire volume of the culture containing the coupled BJAB–DC pairs was washed off the unbound nanoparticles and irradiated by a sequence (ten pulses, 1 kHz repetition rate) of intense (12 mJ/cm^(− 2)), ultrashort (50 fs), resonant (545 nm wavelength) laser pulses.Time-lapse fl uorescence-phase contrast imaging of two exemplary fusion events between BJAB and DCs is shown in Figure 3a. Data analysis based on 1000 cells revealed that fusion between BJAB and DCs was less common (7%) than fusion between homogeneous pairs (or clusters) of BJAB cells only (20%). Moreover, DC–DC fusion was not detected at all, unless a BJAB cell was involved in the fusion process into a DC–DC–BJAB cell hybrid. The irradiated BJAB cells and DCs that were in physical contact showed fi rst signs of morphological changes immediately after irradiation, toward the formation of hybrid cells with a unifi ed cytoplasm after 20–30 min (Figure 3a). A schematic model of the fusion process between engaged cells irradiated by femtosecond pulses is illustrated in Figure 3b, which depicts the local disruption of the cells’ plasma membranes initiated by the several tens of nanometers in diameter cavitation bubble that has been formed around the particle. In addition to DCs, foreign or tumor antigens could also be presented to the adaptive immune system by macrophages, following attachment and fusion with the target cells. To demonstrate the induction of fusion between macrophages and malignant B cells, monocyte-derived macrophages expressing CD86 surface receptors were mixed with CD20-expressing BJAB cells and incubated within a medium containing bispecific anti-CD20–anti-CD86 nanoparticles. After 15 min of incubation, nearly 50% of the macrophages in the culture were found attached to BJAB cells (Figure 4a,b), a significantly higher rate compared with coupling in a nanoparticle-free medium (20%). In contrast, the use of monospecific anti-CD86 nanoparticles resulted in 26% macrophage–BJAB cell attachment and 30% macrophage–macrophage attachment. After irradiation by a single sequence (ten pulses, 1 kHz repetition rate) of femtosecond pulses, approximately 9% of the macrophage–BJAB cell pairs were successfully fused. A typical fusing pair of cells is shown in a time-lapse image sequence in Figure 4c, which reveals the plasma membrane fusion (phase contrast, top row), cytoplasmic (green fluorescence, second row) transfer from the BJAB cell during fusion, and gradual passage of the nuclear blue marker from the macrophage nucleus to the BJAB cell nucleus (third row). Consistently, the fused cells remained viable more than 24 h after irradiation in all fusion experiments.
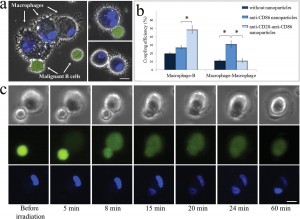
Figure 4
In summary, we have presented a novel technique for selective fusion between antigen-presenting cells and tumor cells, by using specifi cally designed nanoparticles for the attachment of selected cells, and fusion of their plasma membranes following irradiation by a short sequence of resonant femtosecond laser pulses. The low toxicity of the gold particles, high specificity, efficiency, and relative simplicity of this approach would make it useful for a wide range of biomedical applications, and open new possibilities in biotechnology and in fundamental biological research. This approach would also broaden the use of nanotechnology for various biomedical applications by offering effective means for triggering and controlling desired interactions on a nanometer scale, potentially resulting in a more accurate research procedure and
less invasive medical intervention.
References
- Optically Induced Cell Fusion Using Bispecific Nanoparticles
Daniella Yeheskely-Hayon, Limor Minai, Lior Golan, Eldad J. Dann, and Dvir Yelin
Small 10.1002, 201300696 (2013)