Optical microscopy of blood cells in vivo provides a unique opportunity for clinicians and researchers to visualize the morphology and dynamics of circulating cells, but is usually limited by the imaging speed and by the need for exogenous labeling of the cells. Here we present a label-free approach for in vivo flow cytometry of blood using a compact imaging probe that could be adapted for bedside real-time imaging of patients in clinical settings, and demonstrate subcellular resolution imaging of red and white blood cells flowing in the oral mucosa of a human volunteer. By analyzing the large data sets obtained by the system, valuable blood parameters could be extracted and used for direct, reliable assessment of patient physiology.
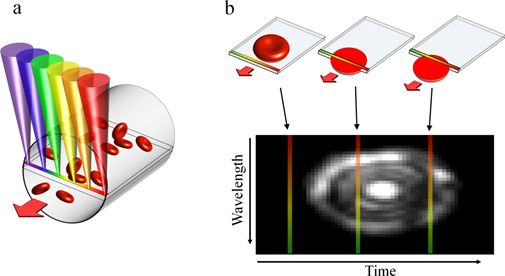
Figure 1
Fig. 1. Image acquisition in SEFC. (a) A single line within a blood vessel is imaged with multiple colors of light that encode lateral positions. (b) A single cell crossing the spectral line produces a two-dimensional image with one axis encoded by wavelength and the other by time.
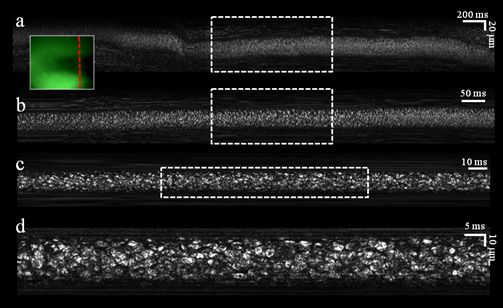
Figure 2
Fig. 2. In vivo noninvasive imaging of blood flow in a single vessel. (a) Raw image acquired during 4 seconds of flow. (b) Crop of the raw data acquired during the period marked by the dashed rectangle in a. (c) Crop of the raw data acquired during the period marked by the dashed rectangle in b. (d) Crop of the raw data marked by the dashed rectangle in c. Inset, an image of the blood vessel as seen through the auxiliary green channel. Dashed red line indicates the transverse location of the spectrally encoded line.
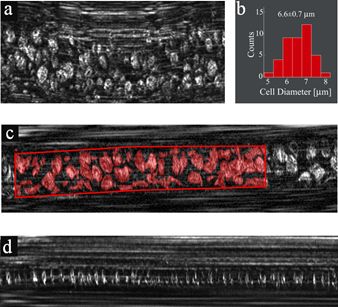
Figure 3
Fig. 3 In vivo imaging in microvessels. (a) RBC flow in a vessel which was slightly deformed by applying external pressure. (b) A histogram showing distribution of RBC diameters. (c) Extracting the fractional area occupied by RBCs in a vessel using manual segmentation for assessing hematocrit levels. Red regions correspond to areas occupied by RBCs. (d) Individual RBCs flowing in a small-diameter capillary.
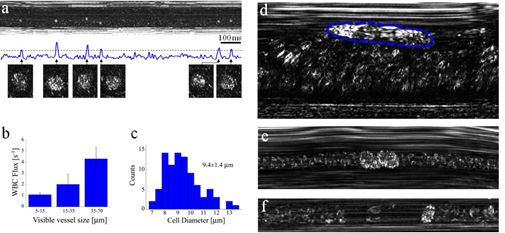
Figure 4
Fig. 4. In vivo imaging of WBCs. (a) Imaging close to the wall of a post capillary venule allows forming a plot of the total intensity across the image as a function of time. Good correlation between the appearances of WBCs (magnified cell images below the plot) and intensity peaks was obtained. (b) Averaged flux of WBCs for different vessel diameters. (c) Diameter histogram of the imaged WBCs. (d) A single rolling WBC (outlined by a dashed blue line) near a vessel wall, characterized by an elongated shape which indicates its low relative velocity (approximately 0.18 mm/s) in contrast to the nearby fast RBC flow (approximately 1.1 mm/s). (e) Two attached WBCs flowing near a vessel wall. (f) A single WBC flowing in a small capillary with a downstream plasma gap (RBC depleted region).
References
- Flow cytometry using spectrally encoded confocal microscopy
Lior Golan and Dvir Yelin
Opt. Lett. 35, 2218 (2010) - Noninvasive imaging of flowing blood cells using label-free spectrally encoded flow cytometry
Lior Golan, Daniella Yeheskely-Hayon, Limor Minai, Eldad J Dann, and Dvir Yelin
Biomed. Opt. Express, 3, 1455 (2012) - Measuring blood velocity using correlative spectrally encoded flow cytometry
Tal Elhanan and Dvir Yelin
Optics Letter 39, 4424 (2014) - Reflectance confocal microscopy of red blood
cells: simulation and experiment
Adel Zeidan and Dvir Yelin
Biomedical Optics Express, 6, 4335 (2015) - In vitro hematocrit measurement using spectrally encoded flow cytometry
Adel Zeidan, Lior Golan and Dvir Yelin
Biomed. Opt. Express, 7, 4327 (2016) - Measuring sickle cell morphology during blood flow
Inna Kviatkovsky, Adel Zeidan, Daniella Yeheskely-Hayon, E.L Shabad, Eldad Dann, Dvir Yelin
Biomed. Opt. Express, 8, 1996 (2017) - In vivo noninvasive microscopy of human leucocytes
Matan Winer, Adel Zeidan, Daniella Yeheskely-Hayon, Lior Golan, Limor Minai, Eldad Dann, Dvir Yelin
Sci. Rep. 7, 13031 (2017)